
EPICENTRE | Lithuania’s ground is moving: from medieval accounts to modern monitoring
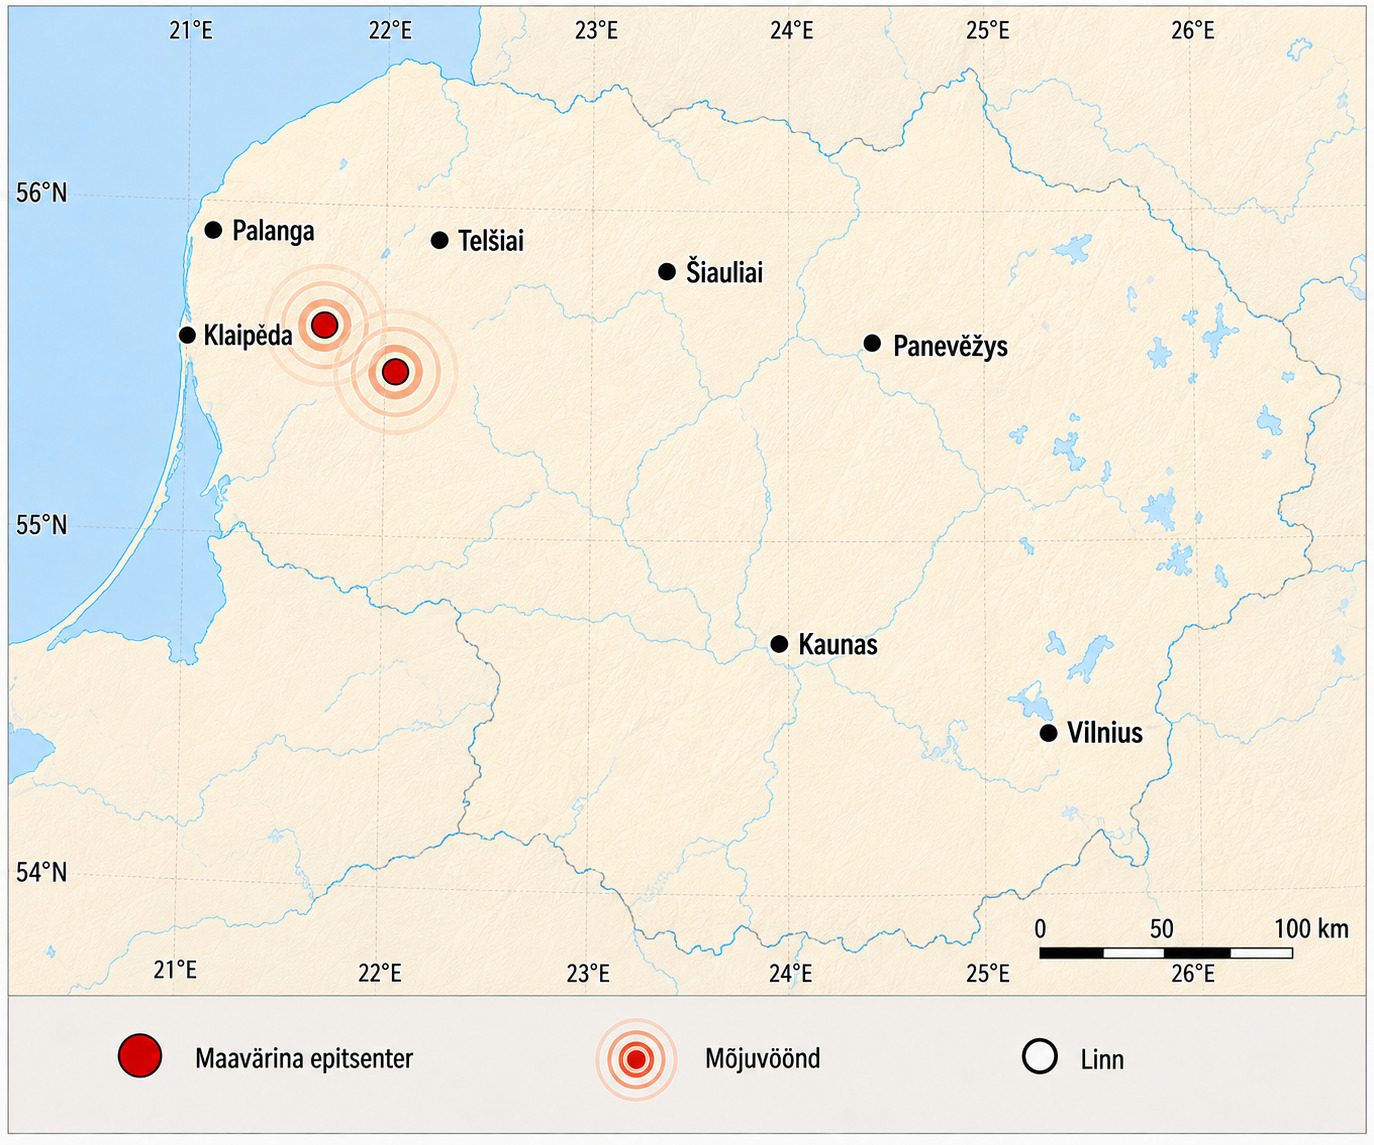
The first earthquake was recorded at 08:35 and the second at 12:03 Lithuanian local time. Their magnitudes were 2.7 and 2.4, respectively. The Lithuanian Geological Survey (Lietuvos geologijos tarnyba, hereafter LGT) described them as the first earthquakes to have been reliably recorded and located within the territory of the country.1 The word “reliably” is important here. Earthquakes have been associated with Lithuania before, but there has not always been sufficient information to determine the origin or precise location of historical accounts. The two earthquakes in 2025 therefore mark a new stage in the history of seismological observations in Lithuania.
Lithuania is located in the western part of the East European Craton. A craton is an old and relatively stable part of the continental crust, and Lithuania lies far from active plate boundaries, where many of the world’s strongest earthquakes occur. The country’s seismicity is therefore low, but even within a tectonic plate, stresses can cause rock blocks to move suddenly along faults. Such earthquakes are known as intraplate earthquakes. In Lithuania’s case, studying them is made more difficult by the small number of events: on the basis of individual earthquakes, it is difficult to determine which old faults may be capable of moving in the present-day stress field. Interpretations of the location and extent of faults are also not always the same across different studies.2
To understand the 2025 earthquakes, it is first necessary to look beneath Lithuania’s surface. The country’s crystalline basement is not uniform: western and eastern Lithuania belong to crustal domains with different structures, separated in broad terms by the north–south-trending Central Lithuanian Suture Zone.A Crustal thickness also varies by region: in the West Lithuanian Domain it is approximately 40–45 kilometres, while farther east it may reach about 50–55 kilometres.2 Lithuania’s crystalline basement is covered by younger sedimentary rocks, which means that its composition and structure are studied mainly through drill cores and geophysical measurements.3 This is precisely why the calm relief visible at the surface does not describe the full geological structure beneath the ground.
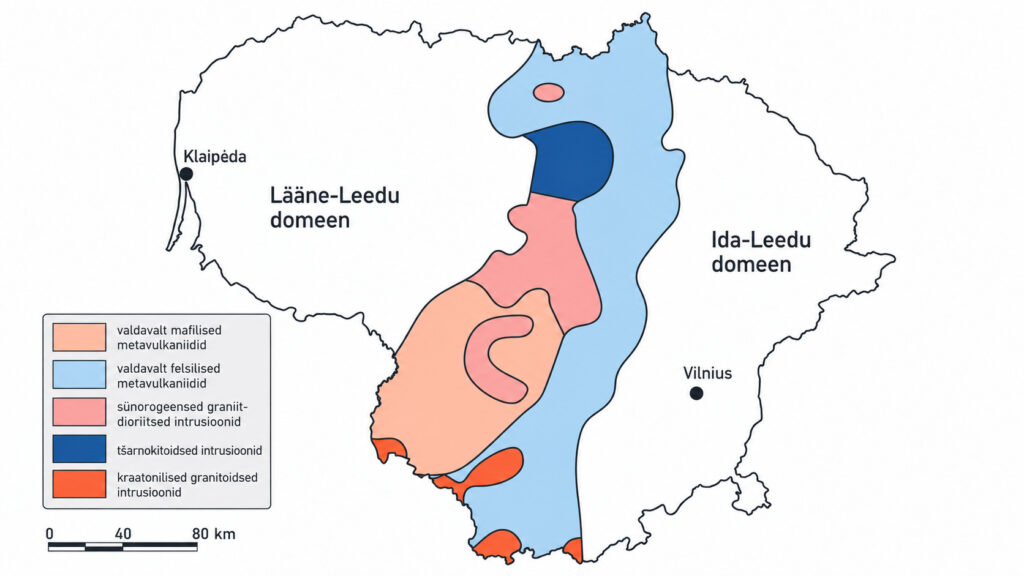
Figure 1. The Central Lithuanian Suture Zone and Lithuania’s main crustal domains.19
The composition of Lithuania’s basement has been substantially clarified by a study carried out in 2008, which also examined the Kuršiai Batholith — a rock body that solidified deep within the crust. Its delineation made use of gravity and magnetic field anomalies together with drill cores from 86 boreholes.3 In discussing earthquakes, however, the significance of such features must be carefully defined, as the existence of a rock body billions of years old does not in itself indicate where the next earthquake will occur. Nor can the cause of the 2025 earthquakes be determined solely on the basis of the geological region in which they were located. For that, the structure of the crust must be linked to specific measurements and to the mechanism of the events. Basement structure describes what the crust is made of, whereas other measurements provide information about the present-day movement of the crust. One way to do this is to monitor how ground elevation changes over decades.
Lithuania rises and subsides by millimetres
Because crustal movement is not expressed only through earthquakes, it can also be observed by comparing precise height measurements taken at different times, a method known as repeated levelling. This is illustrated by a 2009 study and the resulting map of vertical crustal movement rates in Lithuania, based on data from different measurement lines collected between 1965 and 2006.4 Since the height measurements did not cover the country evenly, Lithuanian researchers combined the measured movement with geological and geophysical indicators, including gravity and magnetic fields, the relief of the land surface and crystalline basement, and the thickness of sedimentary layers. On the basis of these relationships, movement rates were also modelled for areas lying between the measurement lines.
The resulting values ranged from approximately −3.5 to +2.5 millimetres per year. The strongest uplift appeared in north-eastern Lithuania, while a trend of subsidence was observed mainly in the south and south-west. Slow uplift or subsidence is not the same as an earthquake. The former describes changes in elevation over years and decades; in an earthquake, sudden movement occurs and seismic waves propagate from it. A map of vertical movement helps to examine spatial differences in crustal deformation, but the colours on such a map cannot be used to read off the probability or magnitude of the next earthquake.4 Its value lies in providing an additional view of Lithuania’s subsurface: low seismicity does not rule out slowly measurable movement, and different methods describe different aspects of that movement. Present-day slow crustal movement can be measured in millimetres, whereas for the seismicity of earlier centuries it is often necessary to rely instead on human descriptions. As we move back in time, the certainty of knowledge therefore also changes.
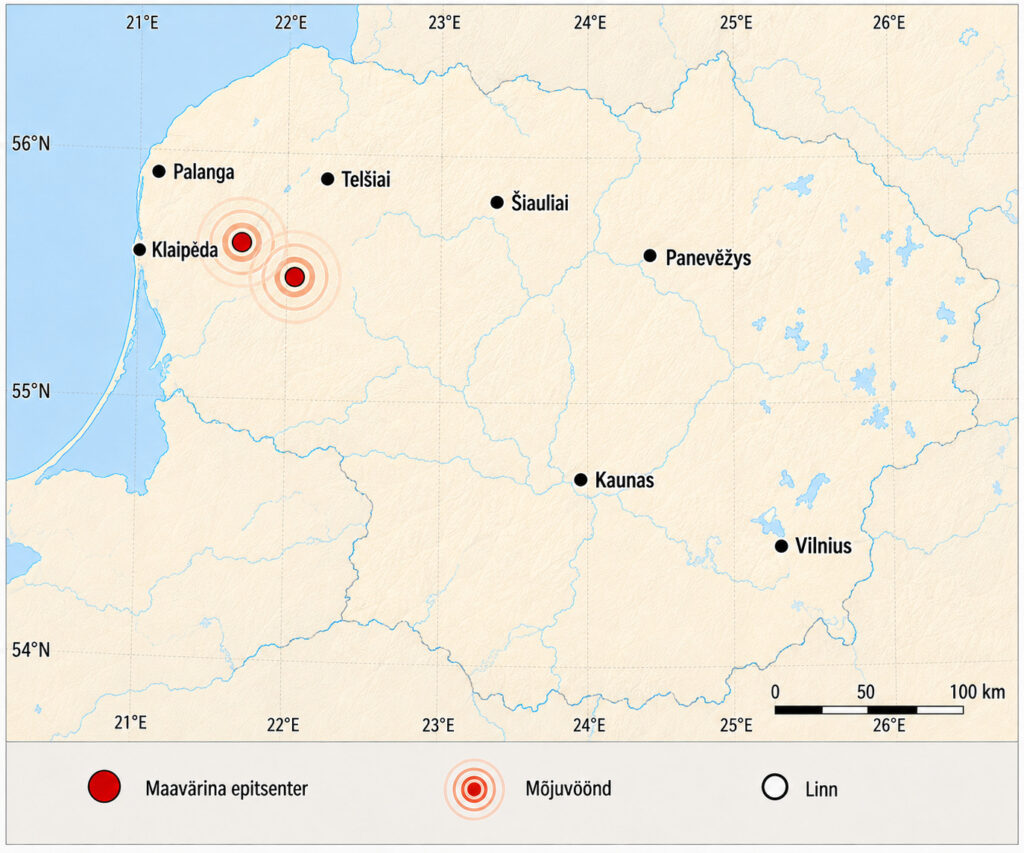
Figure 2. Location of the earthquakes recorded in western Lithuania in 2025.1
Chronicle accounts, distant earthquakes and the Kaliningrad lesson
One of the oldest accounts associated with a possible earthquake in Lithuania dates from 1328 and is linked to Skirsnemunė Castle. Later sources describe ground shaking there, but there is no consensus among researchers on the reliability of this event. The shaking described in Bezdonys near Vilnius in 1909 is also treated with caution, as the original sources do not make it possible to determine with certainty what kind of event actually occurred. Preserving these accounts in the historical record is justified, but they cannot be used to derive an epicentre, focal depth or magnitude with the precision of instrumental measurements. Still less can a ground fissure described in a newspaper be identified as the opening of a crustal fault without further investigation.
Alongside historical local accounts, Lithuania has also felt the effects of stronger earthquakes that occurred elsewhere. For example, seismic waves from earthquakes in Romania in 1940, 1977, 1986 and 1990 reached Lithuania.6 In such cases, it is necessary to distinguish between the actual location of the earthquake and the area where its shaking was felt. If seismic waves arriving from afar cause buildings in Lithuania to vibrate, this does not mean that a new earthquake has occurred in Lithuania.
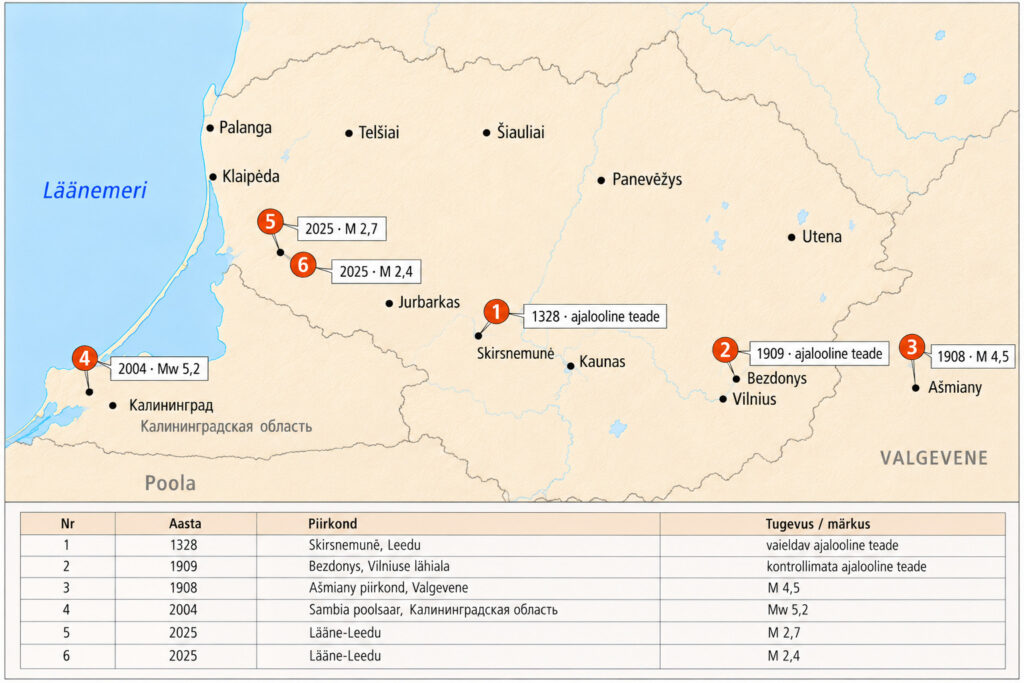
Figure 3. The strongest seismic events in the East Baltic region.1,5,7
While the nature of the Skirsnemunė and Bezdonys events remains uncertain, the Kaliningrad earthquakes of 21 September 2004 were well documented instrumentally. They have subsequently been assessed as two main events with moment magnitudes of Mw 5.0 and 5.2, with their hypocentres placed at depths of approximately 16–20 kilometres. The tremors caused minor damage in southern and western Lithuania as well,7 and their significance for local hazard assessment was considerable, as felt earthquakes have been recorded relatively rarely in the East Baltic region. Although each event provides important information on wave propagation and the region’s possible seismicity, it does not make it possible to determine when the next event will occur.
In its monitoring report at the time, LGT used magnitude estimates of 4.4 and 5.0. When comparing these with later figures, both the assessment method and the magnitude scale must be taken into account. According to the same report, shaking was felt across almost all of Lithuania: in the Klaipėda region the intensity was assessed as V, while around Kaunas and Vilnius it was approximately III.8 Intensity describes the local effect on people, objects and buildings; magnitude describes the size of the event. For this reason, the intensity V effects felt in Klaipėda cannot be described as a magnitude-five earthquake. More precisely, local effects depend not only on the size of the event, but also on distance, focal depth, ground conditions and the characteristics of buildings.
Nevertheless, LGT received numerous calls, especially from western Lithuania. Alongside the analysis of seismograms, residents’ observations were collected, and public authorities and the public were informed. The authority responsible for civil protection in Lithuania also took part in collecting macroseismic information, that is, descriptions of the perceived and visible effects of the earthquake.8 It is important to emphasise here that measurements and human experience complement one another: stations describe the event, while observations describe how it manifested in different places. The observations collected make it possible to compare the instrumental hazard assessment with the shaking actually experienced, and provide additional information for planning seismic hazard assessment, public communication and preparedness. The experience of the 2004 Kaliningrad earthquakes shows that what matters is not only the occurrence of an event, but also the ability to determine its location, strength and impact reliably.
The monitoring network must be able to interpret even weak signals reliably
Lithuania’s earlier measurements show why the 2025 results did not simply mean that two new events had been added to the list. For example, in 2001, a possible tectonic event was recorded by only one station, and the recordings of a possible earthquake near Kaunas in 2007 were not of sufficient quality to determine all the key parameters with confidence.2 In seismology, it is not enough for an unusual vibration to appear in a recording. It must be established whether the signal was caused by an earthquake, blasting or some other source; the arrival times of the signal at different stations must be compared; and the reliability with which the event’s location can be determined must be assessed. A better monitoring network can therefore reveal events that would previously have gone unnoticed or remained uncertainly described.
A seismic station operated in Vilnius from 1970 to 1998.9 An important development took place in 1999, when a four-station system was established around the Ignalina Nuclear Power Plant. Its purpose was to monitor regional seismicity and support the safety of the plant. The network was modernised in 2008 and transferred to LGT in 2018. National monitoring was further expanded by the Paburgė station in 2011 and the Paberžė station in 2012. Both were connected to the international GEOFON network.10 In this way, a system originally created for the safety of a single facility became part of Lithuania’s wider seismic monitoring.
According to LGT, the signals from the two events recorded in western Lithuania in 2025 resembled those of tectonic earthquakes, and this interpretation was also supported by seismologists at the University of Helsinki. Since the events occurred near active oil fields, LGT considered it possible that they may have been induced earthquakes, meaning earthquakes influenced by human activity.1 This cannot, however, be concluded on the basis of location alone. Assessing a causal relationship requires comparison of the location and timing of the events, the geological structure and production data.
The proximity of an oil field and an epicentre therefore gives reason to investigate a possible connection, but does not in itself prove one. The task of the monitoring network is also to distinguish earthquakes from vibrations directly caused by human activity. LGT’s 2025 catalogue contained 815 events, of which 743 were classified as local.B Of these, 21 were classified as natural or induced earthquakes, while the rest were mainly blasts or probable blasts. These figures also include the area surrounding Lithuania.1 The waves from a quarry blast and an earthquake may reach the same stations, but their source mechanisms and significance are different. The quality of monitoring is therefore determined not only by the number of stations, but also by data exchange, analysis and the ability of specialists to interpret signals correctly.
How great could the damage be?
A seismic hazard map shows how strong ground shaking may be in a given area. Actual damage, however, also depends on how many people and assets are located in that area, and how vulnerable buildings and infrastructure are. In Lithuania’s 2012 study, peak ground acceleration was estimated at up to 32.6 cm/s2 in the eastern part of the country, 25–30 cm/s2 in the north, and 10–20 cm/s2 across most of the territory. These values corresponded to a 10 per cent probability of exceedance in 50 years.2
In the risk profile prepared by the World Bank’s Global Facility for Disaster Reduction and Recovery (GFDRR), the average annual capital loss from earthquakes was estimated, under 2015 conditions, at about 500,000 US dollars. For an event with an approximate return period of 250 years, capital loss was estimated at about 20 million US dollars and affected GDP at about 60 million US dollars.11 These sums are modelled estimates, not losses that actually occur every year. Affected GDP and direct asset damage are also different things and cannot simply be added together.
A 250-year return period does not mean that such an event occurs exactly once every 250 years. Such a return period corresponds to an annual exceedance probability of approximately 0.4 per cent.11 It should also be borne in mind that these calculations are based on 2015 population and economic data. They therefore cannot be presented as an exact damage forecast for Lithuania today, but they help to show how much the consequences of rarer and stronger events may differ from the long-term average. GEM’s 2023 risk profile for Lithuania uses event-based modelling and a 100,000-year synthetic earthquake catalogue. This does not mean 100,000 years of actual observations, but a computational simulation used to assess possible events and losses. The model includes residential, commercial and industrial buildings, but not, for example, schools, healthcare buildings or infrastructure.12
For that reason, it does not show the full possible societal impact. The effect of service disruption, for example, depends not only on physical damage, but also on how many people the service affects, whether alternatives are available and how quickly operations can be restored. A national average risk picture still does not show how important the same rare hazard may be for a specific critical facility. Where safety must be maintained for decades, and where the consequences of a possible failure could be very serious, seismic hazard must be assessed even when the probability of an earthquake is low. In Lithuania, Ignalina is such an example.
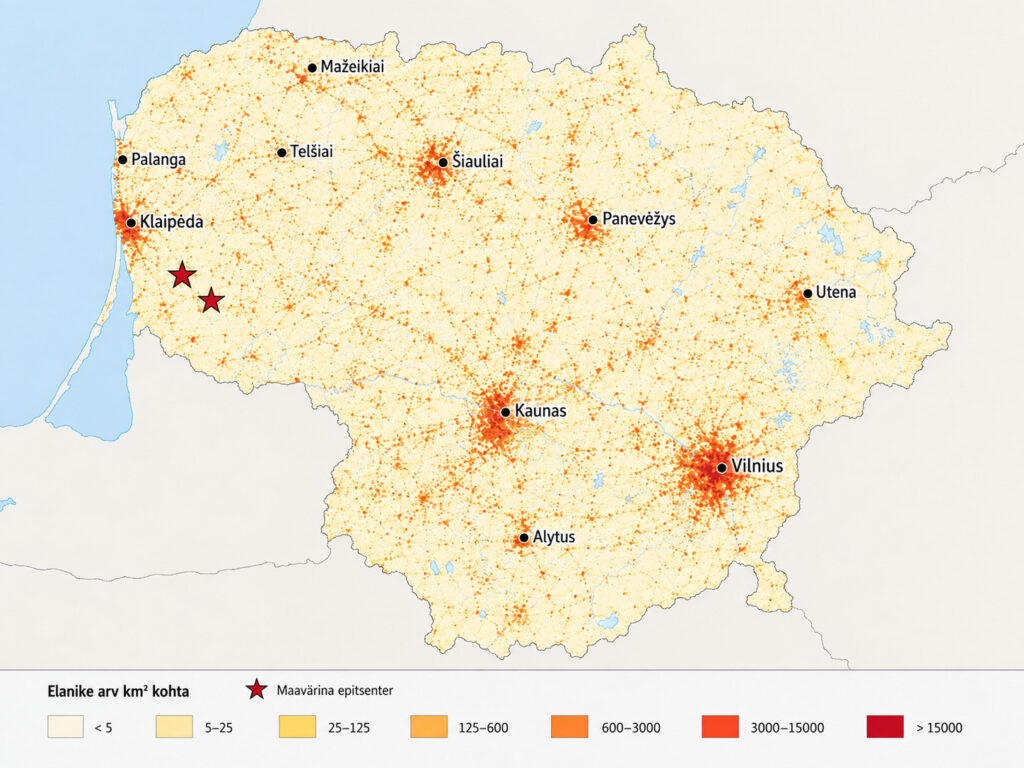
Figure 4. Population density of Lithuania..
The Ignalina safety task outlasts electricity generation
In the case of Ignalina, the need to account for seismic hazard continues even after the end of electricity generation. The first reactor unit at the nuclear power plant was shut down on 31 December 2004, and the second on 31 December 2009. The site’s activities nevertheless continued through decommissioning, the dismantling of equipment and the management of radioactive waste.13 The end of electricity generation changes the condition and functions of the facility, but the materials and storage facilities on its territory still require continued safety assurance. Treating earthquakes as an external hazard therefore does not require an operating reactor. What matters is which safety functions must be maintained in a particular facility and at a particular stage of its life cycle.
On 21 April 2022, the final, 190th container of spent nuclear fuel was transferred to Ignalina’s new interim storage facility as part of the fuel relocation stage. The Ministry of Energy described this as an important step in freeing the reactor units from fuel and enabling further dismantling work.14 Interim storage and final disposal, however, are different tasks. According to the 2026 overview of Lithuania’s State Nuclear Power Safety Inspectorate (Valstybinė atominės energetikos saugos inspekcija, hereafter VATESI), the commissioning of a deep geological repository for spent nuclear fuel and long-lived radioactive waste is planned for 2068. The facility is currently at the planning stage, and the timetable may change.15
This gives Lithuania’s safety work a time horizon measured in decades, during which knowledge of the waste, storage facilities and their geological environment must be preserved. In the case of a deep geological repository, protection is provided by natural and engineered barriers: deep rock formations, and the structures and materials designed to isolate the waste.15 The study of the geological environment is therefore not a secondary activity, but part of the safety case. At the same time, a national map of vertical movements cannot determine the suitability of a single future repository site. Such a decision requires site-specific studies and an assessment of long-term processes. A national map provides the background, but the safety questions concerning a facility must be answered by analyses prepared specifically for that purpose.
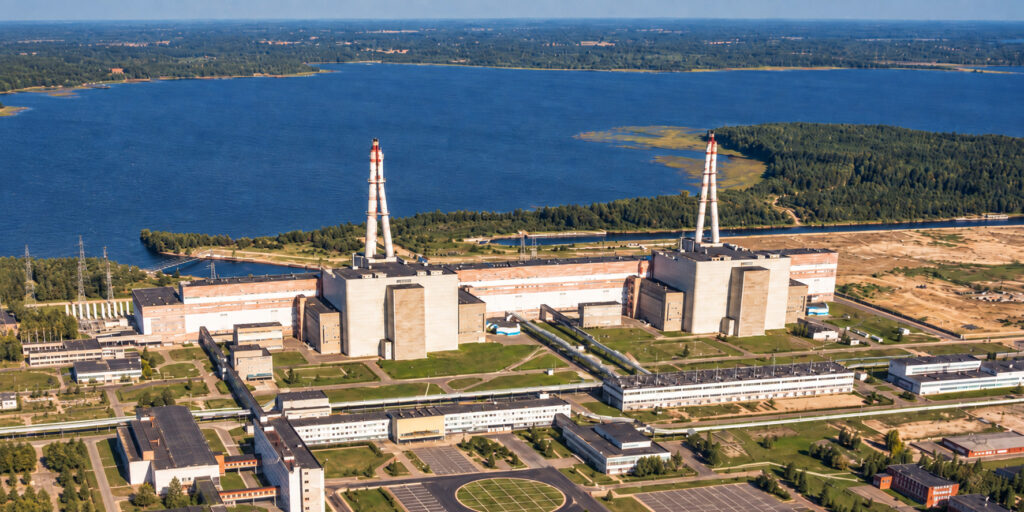
Figure 5. Ignalina Nuclear Power Plant in 1983.
Seismic impact is also a separately regulated area within Lithuania’s nuclear safety framework. VATESI’s list of legal acts includes requirements for the analysis of seismic impact on nuclear facilities, as well as requirements for the ageing management and maintenance of safety-relevant structures, systems and components.16 Its connection with civil protection is practical: hazards must be assessed before an event occurs, and the condition of a facility must be monitored for as long as necessary. At the same time, a single calculated acceleration value or the resilience assessment of one building cannot be extended to an entire complex. The meaning of a safety claim depends on which object, load and mode of operation the analysis actually addresses.
In the European stress tests of nuclear facilities carried out after the Fukushima accident, Lithuania assessed both the permanently shut-down Ignalina reactor units and the dry storage facilities for spent nuclear fuel, including the facility that was still under construction at the time. According to VATESI’s overview, the 2012 international review did not identify any circumstances requiring urgent measures to ensure an acceptable level of nuclear safety. This was followed by an action plan to improve safety: measures related to the Ignalina units and interim fuel storage facilities were completed in 2015, while the remaining regulatory measures were completed in 2018.17 Such scrutiny does not indicate an impending accident; rather, it shows how preparedness for unusual external events and complex accident conditions is assessed.
VATESI’s 2025 regulatory oversight review concluded that Lithuania’s nuclear facilities operated safely. Inspections identified violations, but according to the regulator, none of them could have directly compromised safety barriers or caused the release of radionuclides into the environment; the identified violations were addressed in accordance with the agreed procedures.18 Alongside this, there remains a need to reassess safety whenever facilities, their condition or knowledge of the external environment changes. Safety, in this context, is an ongoing task whose credibility depends on technical solutions as well as the continuity of oversight and specialist expertise.
Lithuania’s earthquake history therefore highlights a part of civil protection that remains largely invisible in everyday life. Household preparedness helps people cope with disruptions, but it cannot replace subsurface research, monitoring stations or safety analyses of critical facilities. Understanding the possible impact of oil production requires production and monitoring data; the safe management of nuclear waste requires site-specific studies and long-term oversight. These tasks continue even when public attention shifts to other threats. For Lithuania, a rarely manifested seismic hazard therefore means, above all, the need to preserve the people, data and institutions capable of assessing a new event even decades after the previous one has passed.
Remarks
A A suture zone is a zone where crustal blocks were once joined together. In geological and geophysical usage, the definition of a suture zone may differ. A geophysical definition is based on a physical signal extending through the full thickness of the crust, whereas a geological definition usually refers to a line or zone that can be identified at the surface.20
B In the LGT definition, a “local event” refers to an epicentral distance of less than 800 kilometres, meaning that these figures also include events in the wider area surrounding Lithuania.
Figures: diagrams of Lithuania and an AI-restored image of the Ignalina Nuclear Power Plant (Crisis Research Centre, 2026; Dmitrii Petrov/Medium, 2025).
🔺The use, distribution, modification or publication of the text, photographs and illustrations is permitted only with the prior written consent of the NGO Crisis Research Centre. Any unauthorised use is prohibited.
Sources
2 Lazauskienė, J., Pačėsa, A., & Satkūnas, J. 2012. Seismotectonic and seismic hazard maps of Lithuania – recent implications of intracratonic seismicity in the Eastern Baltic Region. Geologija, 54(1), pp. 1–9.
17 [Anon.]. 2024. Stress tests. 03.04.2024, Valstybinė atominės energetikos saugos inspekcija.
19 Šliaupa, S., SatkÒnas, J., Motuza, G. & Šliaupien, R. 2017. Morphotectonic implication of the Paleoproterozoic Mid-Lithuanian Suture Zone. Geological Quarterly, 61(3), pp. 590–601.
20 Harris, A. L. & Fettes, D. J. 1988. The Caledonian-Appalachian orogen. Geological Society. Blackwell Scientific Publications, Oxford: England, p. 4.
Jaga postitust: