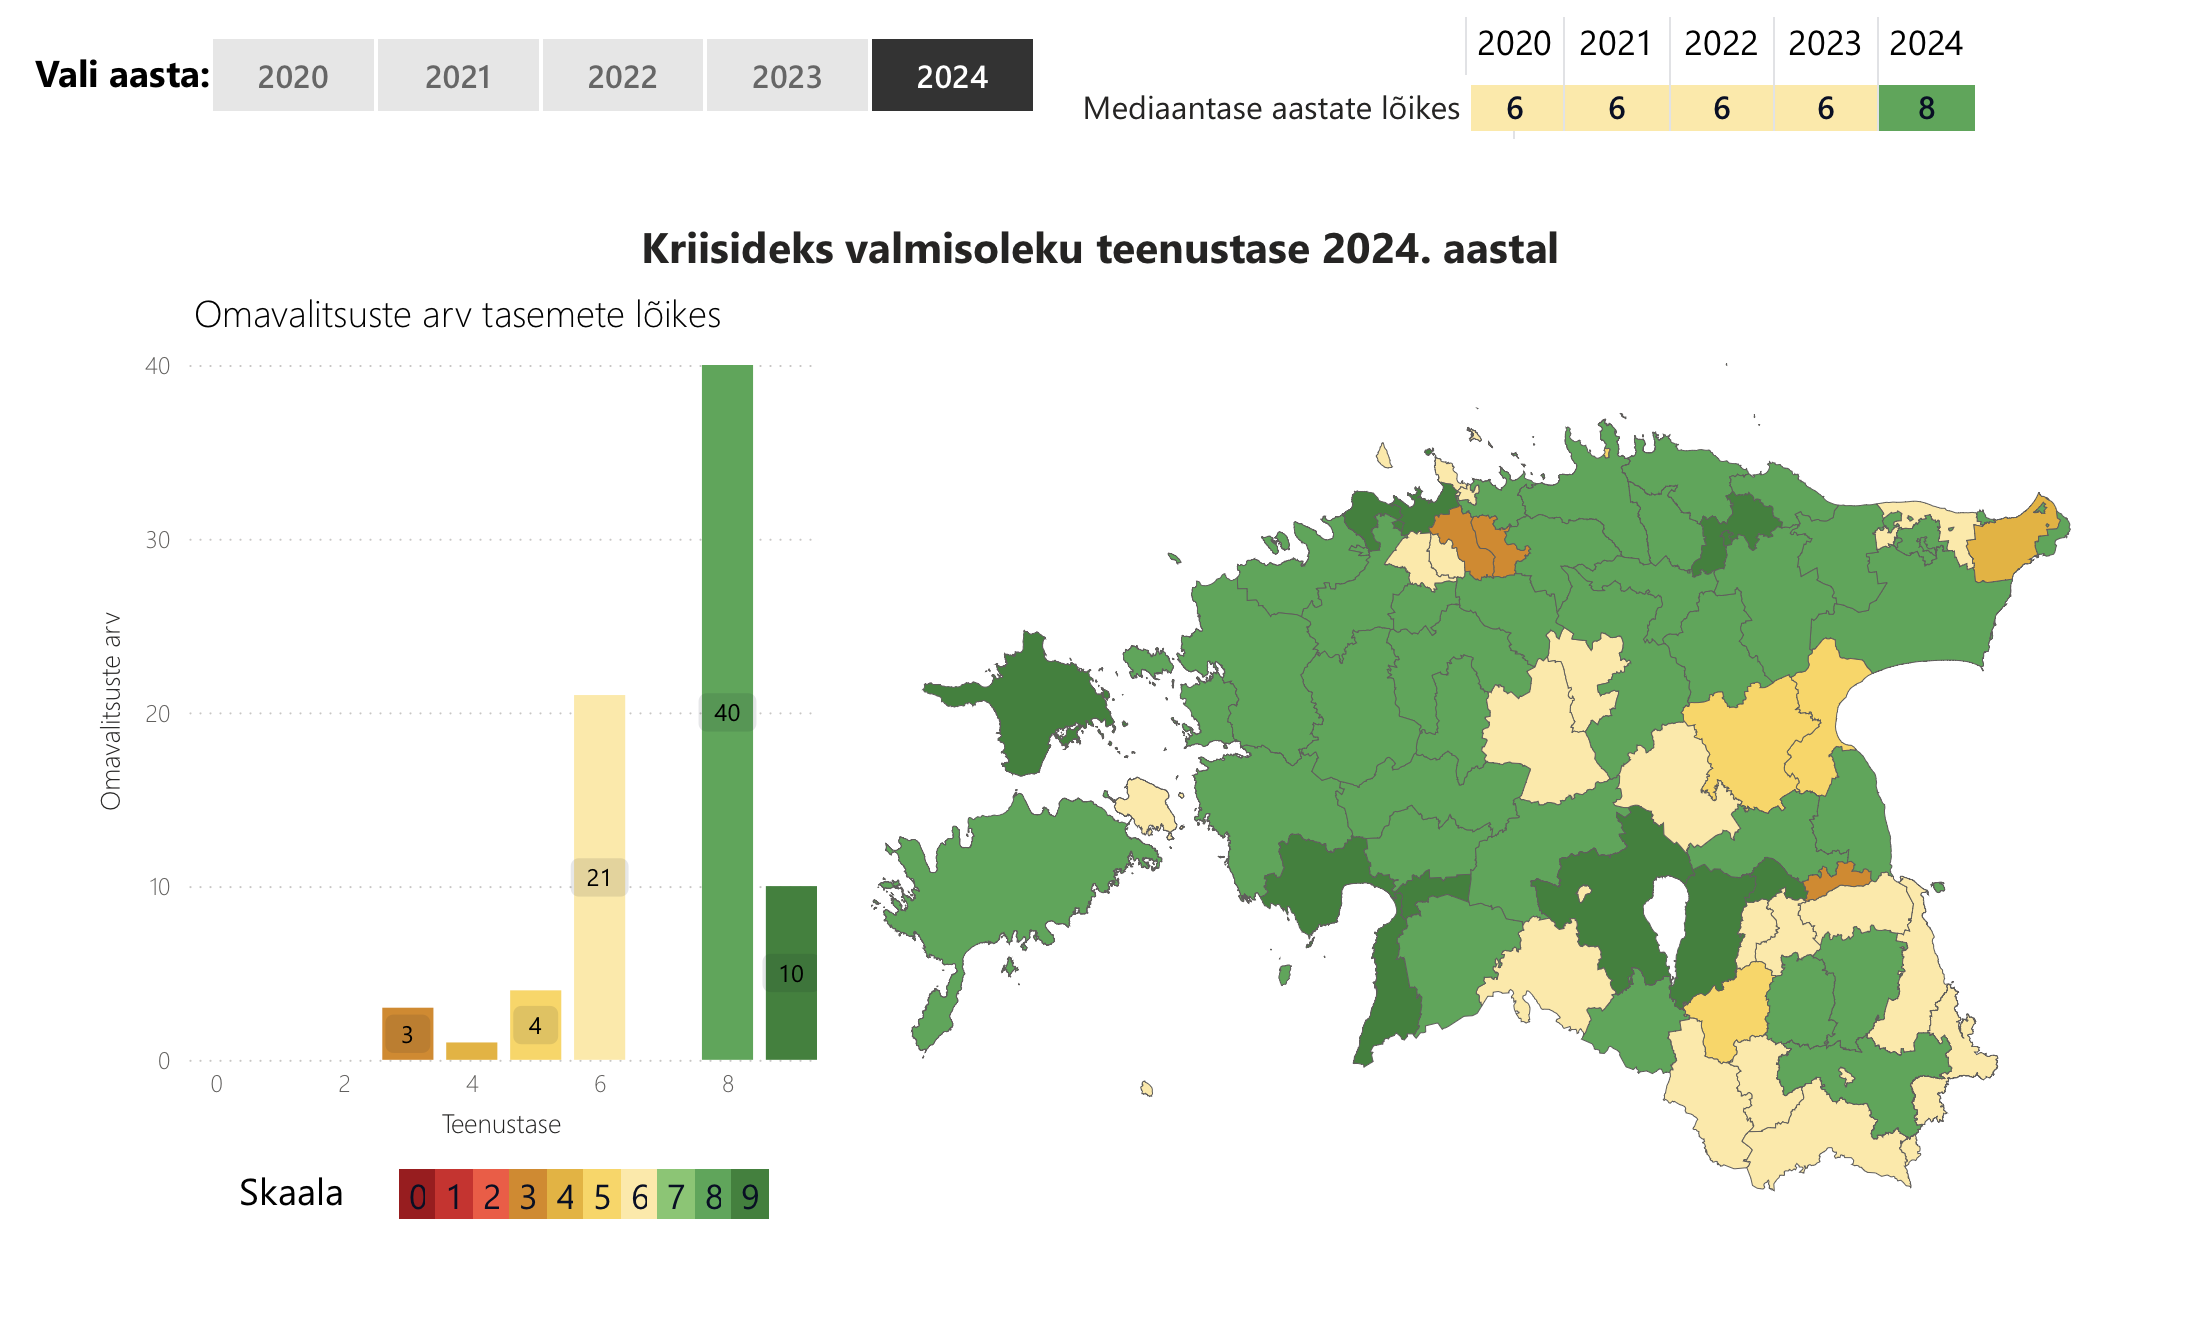
How do we know if Estonian local governments are prepared for crises?
It is in the interests of every outgoing and incoming local government leader, as well as residents, to know how Estonian local governments are doing in terms of crisis preparedness. The state assesses this through a service level model across local governments over a number of years, and the results are available for each local government on the minuomavalitsus.ee portal. At first glance, everything seems positive – the service level of local governments is calculated on the basis of data, which is becoming greener on the map every year, as if confirming that crisis preparedness is improving rapidly.
The assessment is based on crisis preparedness criteria, in which it is possible to achieve a basic, advanced, or exemplary level. For example, there is a criterion called “The crisis committee is functional,” in which the local government is assessed according to its activities to determine how well it is performing. Based on the fulfillment of the criteria, the overall service level is calculated on a scale of 0–9 (the better you are, the higher the final score). Looking at the service levels, it seems that local governments are increasingly prepared for crises, but a closer look reveals that an increasingly green map can be misleading.
There may be situations where local governments appear to be increasingly competent, but their actual readiness remains stagnant. The problem lies in the inconsistency of the methodology used. Firstly, as mentioned above, the descriptions of the criteria levels have been changed. For example, in 2022, local governments were assessed according to 26 criteria, and in 2024, according to 27. One criterion was added and the level descriptions were changed for as many as seven (nearly a third!) criteria. In practice, this means that if a local government achieved the advanced level for fulfilling one requirement in one year, it later achieved it for a slightly different activity. As a real-life example, I would like to compare a situation where in one year the criterion for graduating with a gold medal is a grade of “5” in all subjects, but in the next year, half of the grades can be “4” and the medal is still awarded. In this case, the school would say that we are getting better and better, there are more medalists.
In this method, the scale itself (basic level–advanced level–exemplary) has remained formally the same, but what is understood by, for example, exemplary level may have changed from year to year. For example, if in 2022 the criterion “Assistance is guaranteed to risk groups in emergency situations” at the basic level meant that “risk groups as defined by the Social Welfare Act have been mapped,” then by 2024, the wording was limited to the general phrase “persons belonging to risk groups have been mapped.” The result is two essentially different indicators. In 2022, some criteria did not have an “exemplary” level at all, but by 2024, this had appeared. This means that there could be a sudden increase in the number of local governments that are suddenly exemplary (and receive more points) because a new assessment level has been created. Such seemingly minor shifts can tip some local governments into being more advanced, and others into being exemplary – or perhaps more competent.
Secondly, some of the indicators have become less stringent over time. In 2021, an exemplary, or highest-level, local government had to be able to guarantee evacuation sites for at least 10% of the population under the criterion of “extent of evacuation sites” (Kaal & Lillo, 2023, p. 23). By 2024, this had disappeared: it is sufficient to have 2% of places, with the actual scope describing only the “basic level.” A municipality can now be considered exemplary even if the scope of evacuation sites, i.e., the capacity to accommodate people, has not been increased, but other issues have been addressed. Thus, some local governments may once again “rise” from one level of crisis preparedness to another without their actual capabilities having improved.
Thirdly, the methodology for collecting data has been inconsistent. In 2018–2019, information was collected solely on the basis of documents, while in 2021, interviews were conducted by officials from the Rescue Board themselves – the very same people who are supposed to be monitoring local governments. It was not until 2023 that a method combining document analysis and surveys was introduced, which its creators have said will help reduce the influence of officials as interviewers on the results (Kaal & Lillo, 2023, p. 18). Thus, it is not possible to speak of a uniform and comparable data series.
The fourth problem is that the criteria levels are used to calculate the service levels of local governments and, in turn, the median level for Estonia, with both measured in terms of development over the years. However, given the problems, it cannot really be said that the averages reflect the actual situation. If the content of the levels changes over time, the aggregate levels cannot be used for decision-making or comparison. To put it bluntly, the map may become greener and greener, but this does not guarantee that preparedness has actually improved.
The problem is that decisions are made based on crisis preparedness service levels. When politicians or government agencies see that the average level is rising and the maps are turning greener, they are tempted to declare success and reduce attention and resources (money) in the area. But what does it mean for citizens if we have a false understanding of local governments’ crisis preparedness, even if only partially? For example, in the context of a military crisis, this could mean the following: the evacuation plan is “exemplary” on paper, but at the critical moment, there are no people to implement it; the list of public hidings places is available on the web portal, but the doors are closed; the crisis committee has met three times a year, but the actual development of the field is questionable. This means an illusion of preparedness.
However, a separate question is why we claim to be ready at all. The current system treats all crises with the same yardstick – storms, cyber incidents, and drone warfare are all placed on the same scale, regardless of their scope. In reality, no local government is ready for drone warfare, but the map may give the impression that they are at an “exemplary” level.
A database that purports to show the comparability of local governments may create a false sense of security, which in turn may lead to the misallocation of resources, leave actual shortcomings unresolved, and undermine the credibility of both local governments and the state in crisis management. In summary, due to methodological confusion, no one can reliably say today to what extent the crisis preparedness of local governments has improved in recent years. This is not just a technical or wording problem – if the underlying data is not comparable, conclusions about improvements in preparedness cannot be reliable. This can lead to false positive results.
Crisis preparedness assessments can only be reliable if the methodology is stable and transparent. In order to ensure comparability, the descriptions of the levels must not be reworded from year to year, and if this is done, the changes must be clearly highlighted and their impact on comparability must be demonstrated. Only by doing so can decision-makers obtain an adequate data-based overview and residents an honest picture of the crisis preparedness of their home region.
× The op-ed (by Hannes Nagel) was first published on October 10, 2025 on the Estonian Daily web portal. Photo: portal screens (Kriisiuuringute Keskus, 2025).
Jaga postitust: